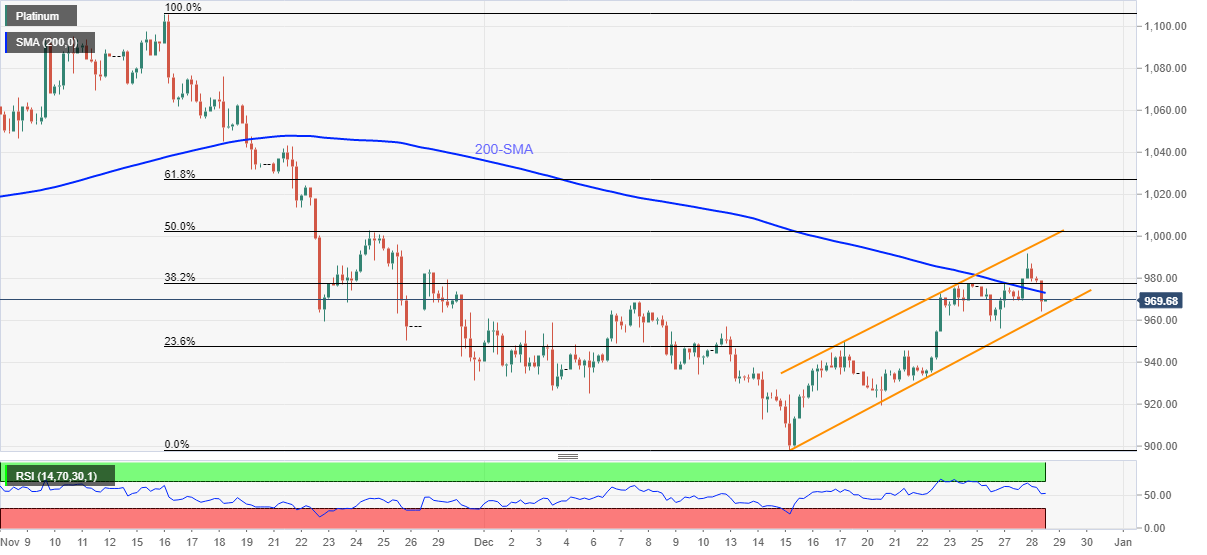
Platinum Price Analysis: XPT/USD prints bear flag on 4H, focus on $960.00
- Platinum prints heaviest intraday losses in two weeks following the pullback from monthly high.
- Bearish chart pattern joins downbeat RSI, failures to cross 200-SMA to favor sellers.
- Bulls need to cross 50% Fibonacci retracement for confirmation.
Platinum (XPT/USD) remains pressured around $969.00, down 0.85% intraday the late Asian session on Wednesday.
The bullion prices refreshed monthly top while crossing the 200-SMA the previous day, before taking a U-turn from $992.00.
The pullback moves dragged the quote back below the 200-SMA while keeping it inside a two-week-old ascending trend channel formation, forming part of the bearish flag pattern.
That said, the downbeat RSI line, not oversold and failures to cross the key SMA add to the bearish bias for the XPT/USD.
Even so, the platinum sellers will wait for a clear downside break of the stated channel’s support line near $960.00, to convince the bears to challenge the monthly low of $898.00, a break of which will set the ball rolling for theoretical target near $750.00.
On the flip side, the recovery moves remain elusive until staying successful beyond the 200-SMA level of $973.00, albeit the stated channel’s resistance line near $998.00 will act as an additional upside filter.
It’s worth noting that the XPT/USD advances past $998.00 will be challenged by the $1,000 threshold.
Platinum: Four-hour chart

Trend: Further weakness expected
