GBP/USD eases from critical daily resistance near 1.3770 amid firmer USD
- GBP/USD snaps three-day uptrend, as 1.3768 remains a tough nut to crack.
- Firmer yields, US dollar recall cable sellers, as Bailey’s comments ignored.
- Will GBP/USD yield a symmetrical triangle breakout on the 1D chart?
GBP/USD has faced rejection once again near the 1.3770 region, with the bears now fighting back control, dragging the rates lower towards 1.3700.
In doing so, the cable turns into the red zone for the first time in four trading sessions, retreating from four-week highs reached last Friday.
The latest leg down in the spot could be mainly associated with the rebound in the US dollar across the board, as the Treasury yields extend the American Retail Sales blowout-inspired rally amid increasing hawkish Fed’s expectations.
Further, adding to the downside in the spot is the looming Brexit concerns, with the European Union (EU) states growing weary of the Northern Ireland (NI) Protocol, Brexit and the UK bad faith.
The dynamics in the yields and the greenback will continue to have a significant bearing on the cable, in absence of relevant UK/US macro data.
From a near-term technical perspective, the price has stalled the upside at the symmetrical triangle resistance of 1.3768.
A daily closing above the latter will confirm the upside break from the triangle, calling for a fresh run towards 1.3800. The next bullish target is seen at the downward-sloping 100-Daily Moving Average (DMA) at 1.3814.
The 14-day Relative Strength Index (RSI) holds above the midline, keeping the buyers hopeful.
GBP/USD: Daily chart
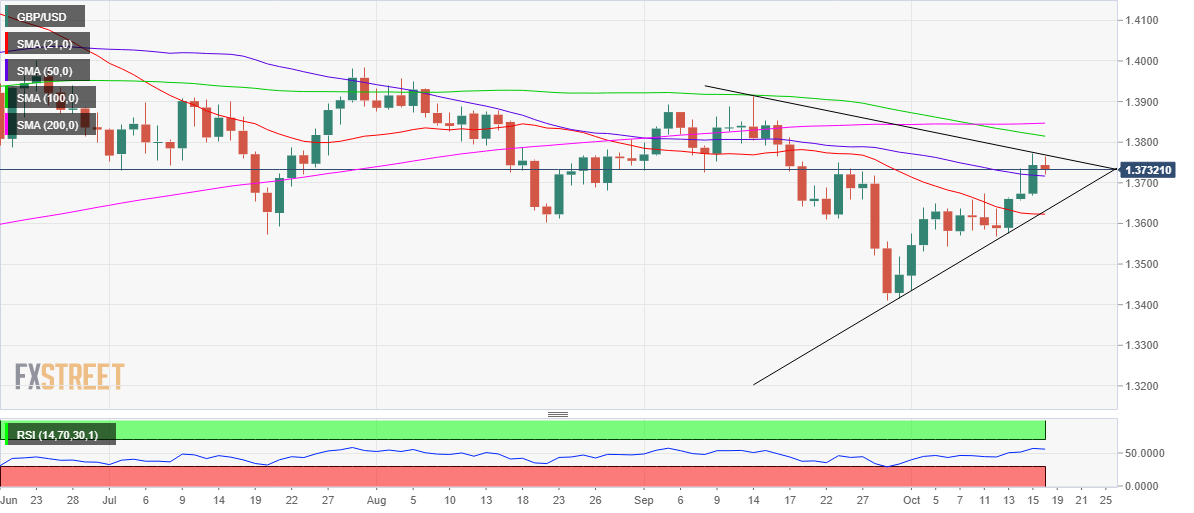
Alternatively, 50-DMA at 1.3716 offers immediate support to the pair, below which a sharp drop towards 1.3625 cannot be ruled out.
That level is the confluence of the 21-DMA and rising trendline (triangle) support.
GBP/USD: Additional levels to consider