GBP/USD Price Analysis: On the back foot below 1.3800, focus on 14-week-old support line
- GBP/USD remains depressed around one-week low, prints three-day downtrend.
- MACD teases bears but key support line, SMA challenge further weakness.
- Monthly resistance line, latest swing high guard short-term upside.
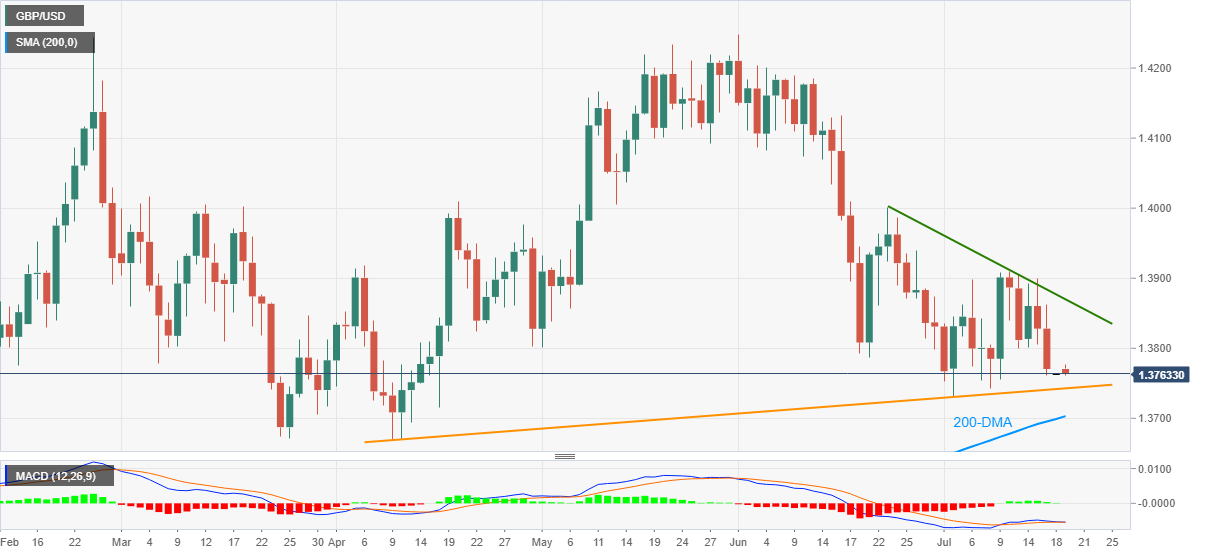
GBP/USD sellers attack a one-week low of around 1.3760 amid a lacklustre Asian session on Monday. In doing so, the cable pair stays pressured for the third day in a row after failing to cross a downward sloping trend line from June 23.
Also backing the pair sellers could be the MACD line that teases the cross over the signal line, suggesting further weakness.
However, an upward sloping support line from early April, around 1.3740, becomes the key support for GBP/USD bears to watch.
Even if the pair drops below 1.3740 on a daily closing basis, the 200-DMA level near the 1.37000 round figure will be crucial to watch.
On the contrary, the corrective pullback may regain the 1.3800 but won’t be considered serious until staying below the stated resistance line, around 1.3870.
Also challenging the GBP/USD buyers is the latest swing high, also the monthly high, of around 1.3910.
Overall, GBP/USD remains directed towards the key support line but any further weakness becomes doubtful.
GBP/USD daily chart
Trend: Bearish