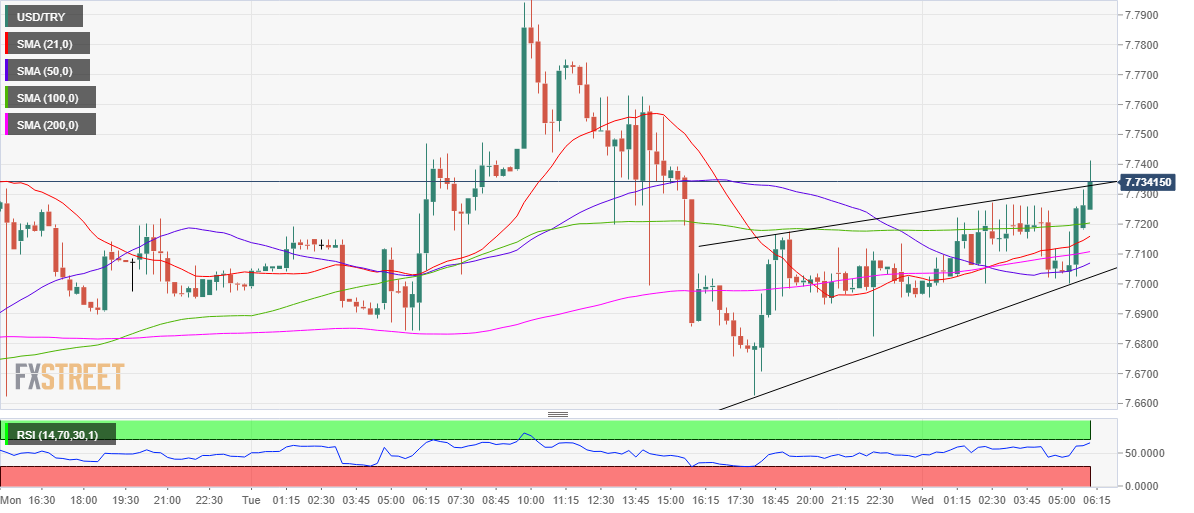
USD/TRY Price Analysis: Probing rising wedge hurdle above 7.7300
- USD/TRY attempts a solid comeback on Wednesday.
- Recent consolidation carves potential rising wedge on hourly chart.
- Hourly RSI keeps points north, eyeing overbought region.
USD/TRY has attempted a solid bounce above 7.7300 on Wednesday, as the bulls storm through all major simple moving averages (HMA) on the hourly chart.
The price has carved out a rising wedge formation on the given time frame, with an hourly closing above the rising trendline resistance at 7.7329 need to confirming a bullish breakout.
The move higher is backed by the hourly Relative Strength Index (RSI) heading towards the overbought territory while trading at 68.01, as of writing.
The buyers now target Tuesday’s high of 7.7983, above which the 8.00 level could be back in sight.
To the downside, the horizontal 100-HMA at 7.7203 could offer strong support. Further south, the bullish 21-HMA at 7.7155 will be put to test.
A sustained break below the rising trendline support at 7.7021 is critical to resuming last week’s downtrend.
USD/TRY: Hourly chart

