Back
11 May 2020
S&P 500 Price Analysis: US stocks dip to the 2900 figure
- The S&P 500 bullish correction from mid-March stay intact.
- Support is seen near the 2900 figure.
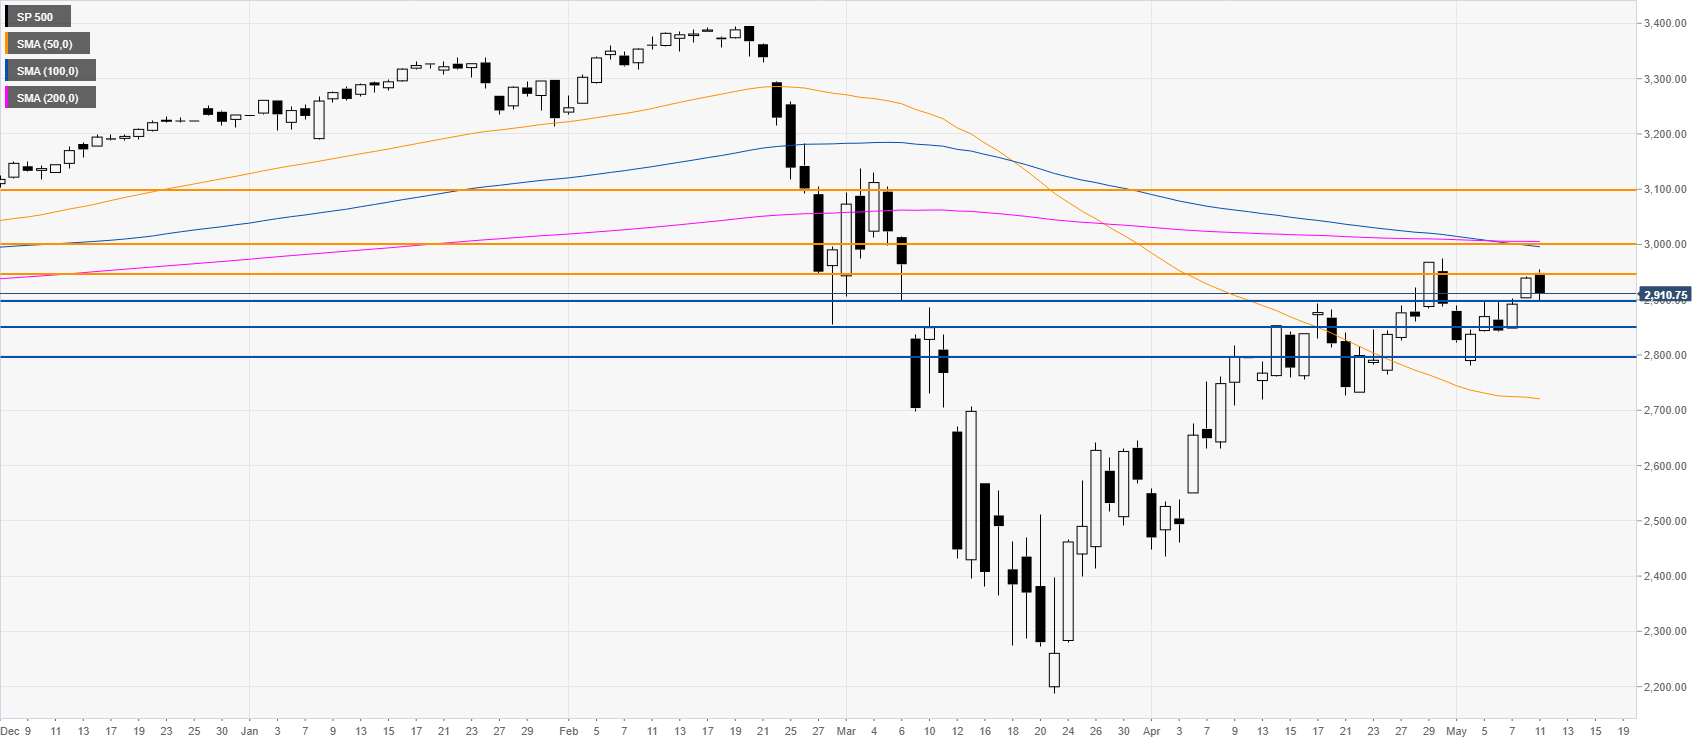
S&P 500 daily chart
The S&P 500 is starting the new trading week with a pullback down to the 2900 figure erasing on an intraday basis the most parts of the gains made last Friday. Bears will be trying to have a daily close below 2900 to target lower levels. However, the market is still in a strong bullish recovery and it remains to be seen how far the bearish move can go.
Additional key levels