USD/CHF Technical Analysis: Sellers focused on spinning top near multi-week high
- USD/CHF declines after registering a bearish candlestick formation the previous day.
- Buyers look for sustained trading beyond 1.0000 psychological magnet.
- 200-day SMA can please sellers during further downside.
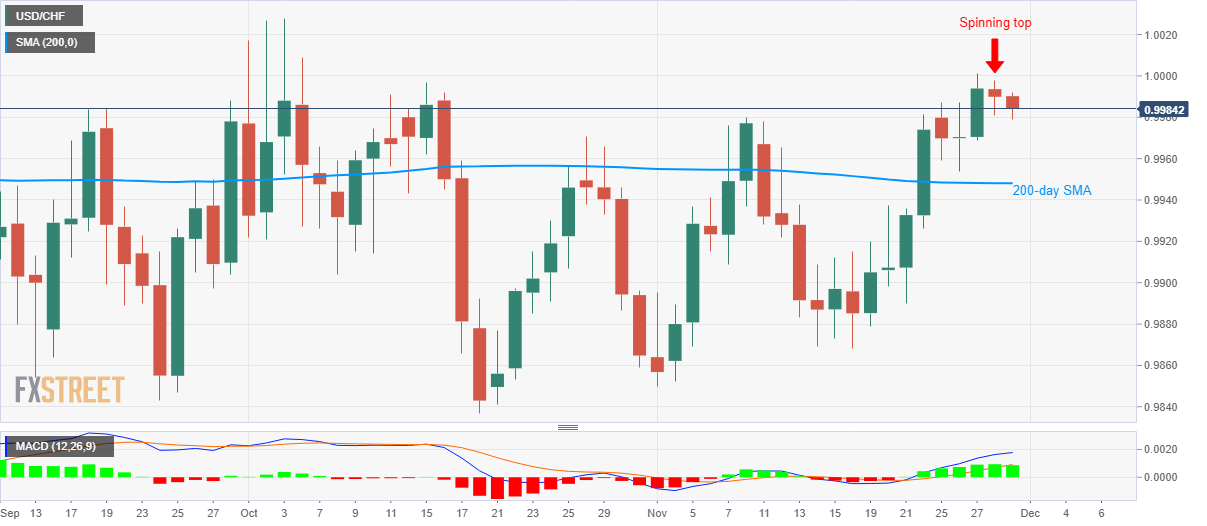
USD/CHF drops to 0.9985 during the early trading session on Friday. That said, the pair formed a bearish “Spinning Top” candlestick formation while taking a U-turn from 1.0000 round-figure.
Considering the pair’s repeated failures to provide a sustained run-up beyond 1.0000, coupled with bearish candlestick pattern, prices are likely declining towards the 200-day Simple Moving Average (SMA) level of 0.9950. Though, late-October high close to 0.9970 can offer an intermediate halt during the declines.
In a case where bears dominate below 200-day SMA, mid-November tops close to 0.9910 can return to the chart.
Alternatively, the pair’s successful rise beyond 1.0000 could target October high around 1.0030 whereas late-May peak close of 1.0100 might lure bulls afterward.
USD/CHF daily chart
Trend: Pullback expected