Back
28 Oct 2019
EUR/USD technical analysis: Euro is trading near daily highs after the London close
- The Euro is consolidating last week’s losses this Monday.
- In the medium term, the level to beat for sellers remains the 1.1065/1.1040 support zone.
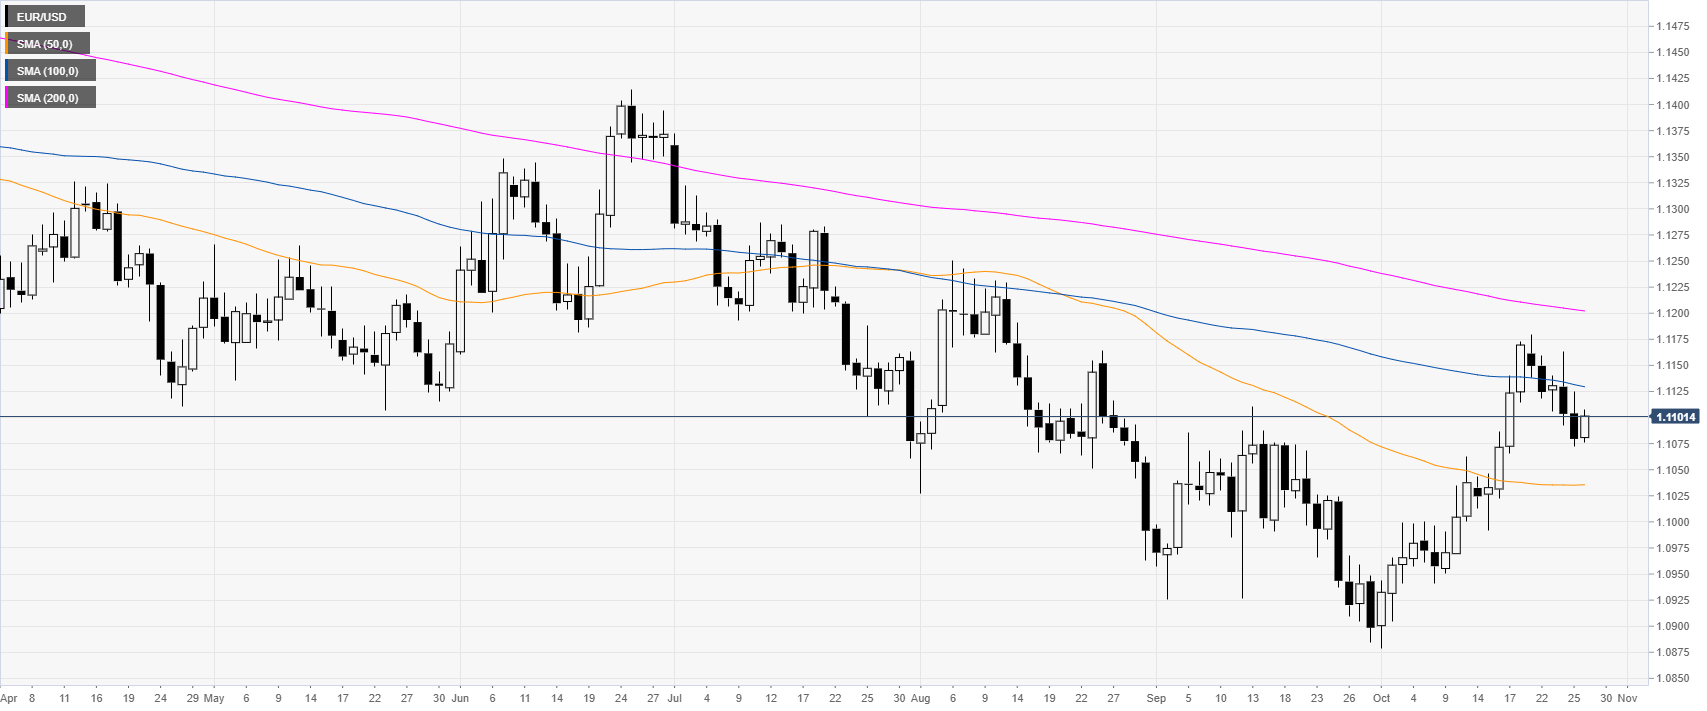
EUR/USD daily chart
On the daily chart, the common currency is trading in a bear trend below its 100 and 200-day simple moving averages (DMAs). Last week, EUR/USD had its worst weekly decline since late September.
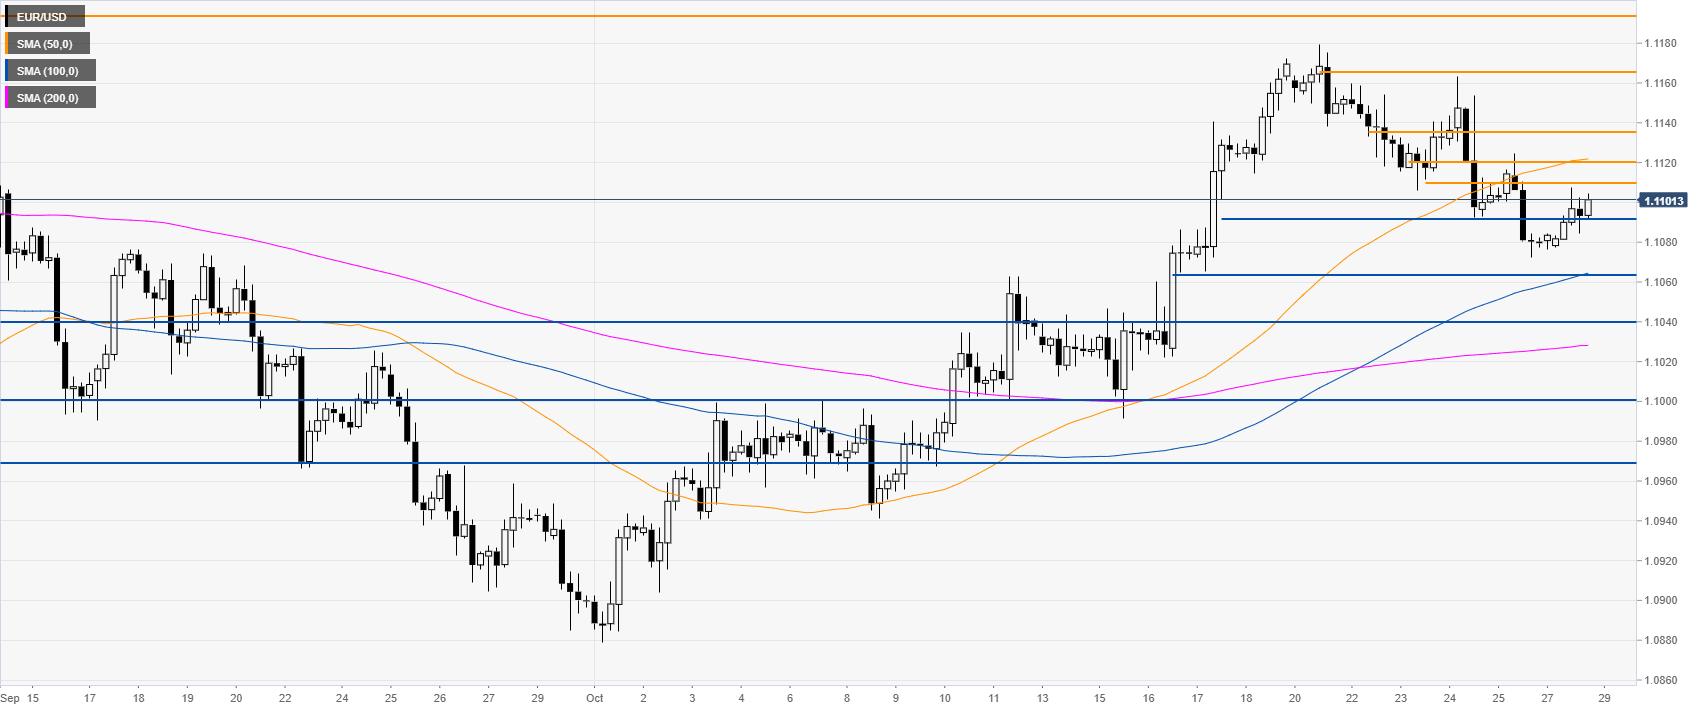
EUR/USD four-hour chart
The Fiber, on the four-hour chart, is trading above its 100 and 200 SMAs. However, the spot is pulling back down from multi-week highs, trading below its 50 SMA. The level to beat for bears is the 1.1065/1.1040 support zone, according to the Technical Confluences Indicator. A break below can send the Euro down to the 1.1000/1.0970 support zone.
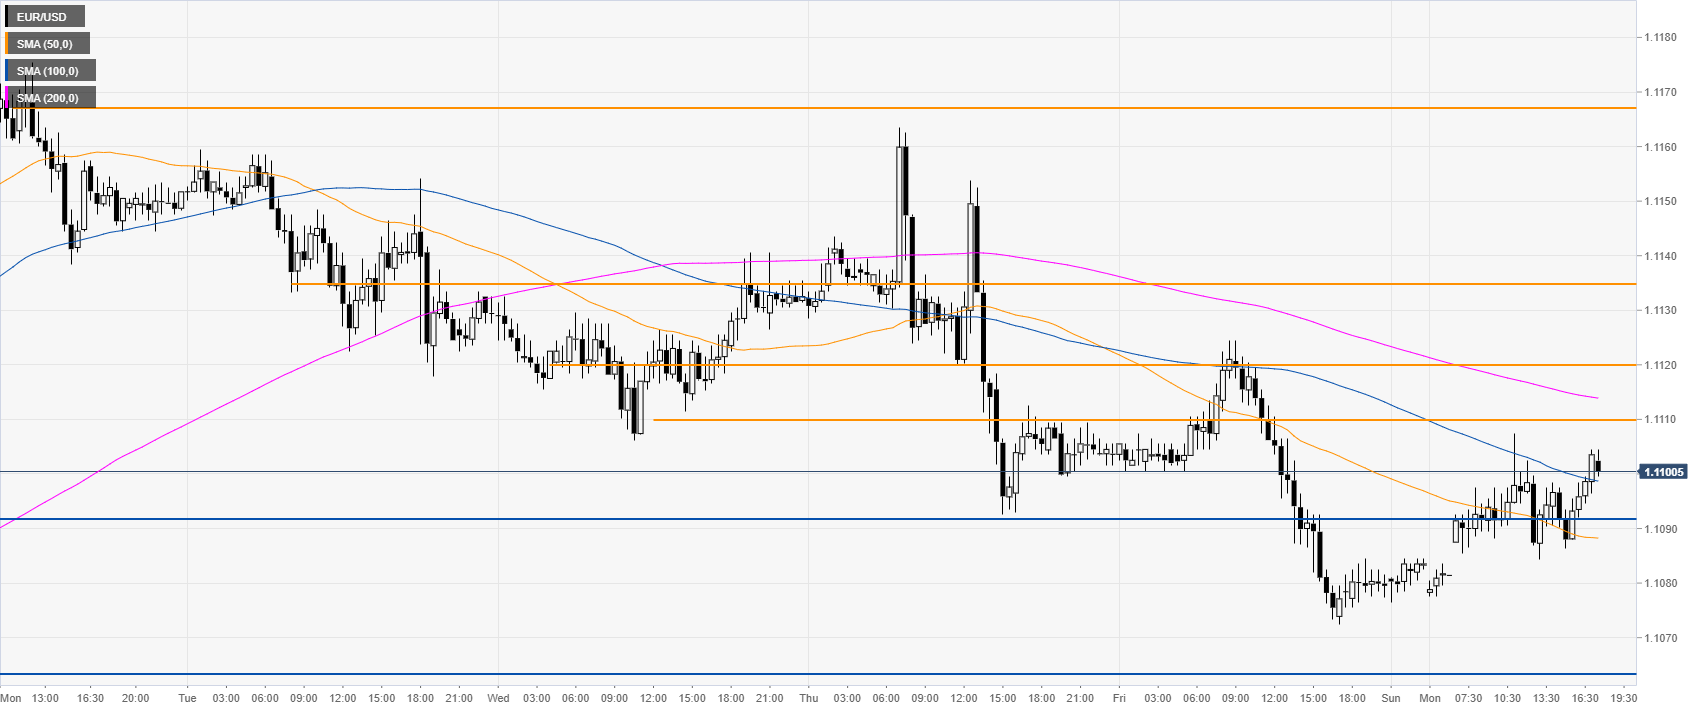
EUR/USD 30-minute chart
The exchange rate is trading between its 100 and 200 SMAs on the 30-minute chart, suggesting a consolidation in the near term. Strong resistance can be seen at the 1.1109 level. Further up, 1.1120, 1.1135 and 1.1167 are the next relevant resistances, according to the Technical Confluences Indicator.
Additional key levels